Burst Scaling without the trade-offs of Burst Scaling
We ran 20 simultaneous voice calls into a system that started with zero containers running. Average response latency across all 20 calls was 603ms -- better than the 953ms baseline of a single call on an idle container. No caller heard silence. No caller heard hold music. No caller got a busy signal.
This post is about how that's possible, and why the conventional wisdom that "scaling and voice quality are in tension" is an artifact of implementation choices, not a fundamental constraint.
In the last post, we solved cold start for voice AI: a gateway bot answers the call instantly while the customer's container wakes up in the background. The caller never notices. That post covered scaling from zero to one. This post covers scaling from one to many.
The problem with CPU-based auto-scaling
The most common default for ECS auto-scaling is CPU utilization, and the feedback loop it creates is slow by design. By default, EC2 instances publish CloudWatch metrics at five-minute intervals. Even with detailed monitoring enabled, metrics are published every minute -- and AWS itself warns that "scaling on metrics with a five-minute frequency can result in a slower response time and scaling on stale metric data."1
The full chain looks like this:
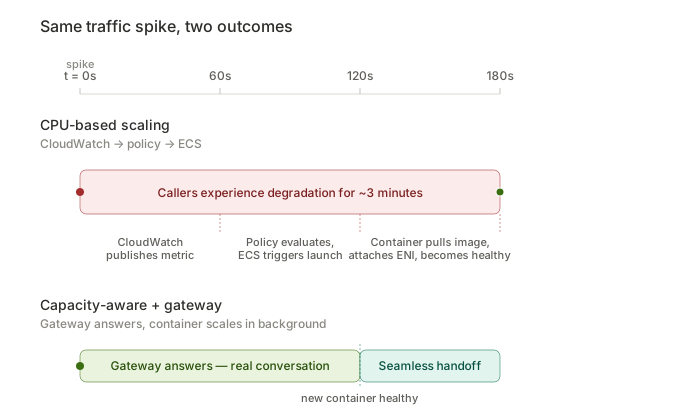
Three minutes is an eternity in voice. Conversational psychology research shows the average gap between speakers in natural dialogue is roughly 200 milliseconds across languages and cultures.2 When response delays exceed about a second, listeners perceive the system as broken or unresponsive.3 The callers who triggered the scale event experience degraded audio, higher latency, and missed words for three minutes while the system catches up. By the time the new container is healthy, the damage is done.
The deeper problem is that CPU is the wrong signal. A container at 60% CPU running six short FAQ calls behaves differently than a container at 60% CPU running six concurrent booking flows with database lookups, SMS dispatches, and calendar integrations. CPU is a proxy for "is this container struggling." What you actually need to know is: "can this container accept another call without degrading the ones it's already handling?"
Counting calls, not cycles
We load-tested our voice pipeline -- STT, LLM, TTS running on 1 vCPU Fargate ARM -- to find the actual quality cliff.4
| Concurrent calls | CPU usage | Avg response latency | vs baseline | What callers experience |
|---|---|---|---|---|
| 1 | ~11% | 334ms | -- | Indistinguishable from human |
| 3 | ~33% | 352ms | +5% | Indistinguishable from human |
| 6 | ~66% | 397ms | +19% | Below perception threshold |
| 7 | ~79% | 461ms | +38% | Noticeable awkwardness |
| 8 | ~88% | degraded | unacceptable | Broken conversation |
The 397ms latency at six concurrent calls sits comfortably below the ~800ms threshold where callers begin to perceive awkward pauses in production voice systems.3 At seven, we cross into territory where humans start to notice. At eight, the conversation breaks down.
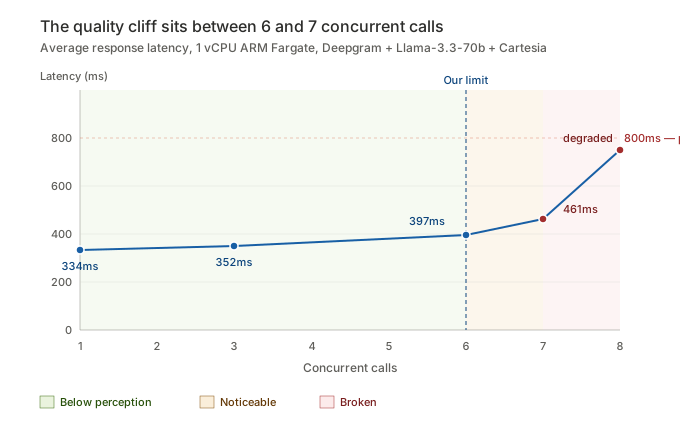
So we set the limit at six. Not from a CPU threshold, not from a memory alarm, but from measuring what callers actually experience.
How scaling decisions happen
Every container tracks its concurrent call count in Redis.5 When a call connects via WebSocket, the counter increments. When the WebSocket closes, it decrements. This is the source of truth for capacity -- not CloudWatch metrics, not ECS task counts, not in-memory variables that die with the process.
The ALB health check reads this counter. When a container hits 6/6, its /health endpoint returns 503. The ALB marks it unhealthy within 20 seconds and stops routing new calls to it. Existing calls are unaffected -- the ALB keeps their WebSocket connections alive.
The next inbound call finds no healthy targets. The ALB returns 503. Twilio's VoiceFallbackUrl kicks in and routes the call to the gateway, which answers immediately while a new container spins up in the background.
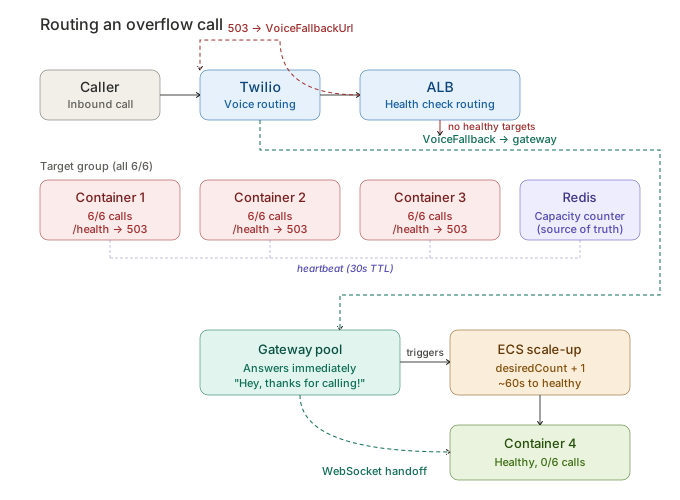
The caller who triggered the scale event gets a real conversation, not hold music, not a busy signal. The gateway runs the same persona, the same voice, the same business logic, connected to the same databases. The only difference is which container is running the pipeline.
Why "active_containers + 1" is the whole scaling policy
We tried complex approaches first. Capacity registries with aggregate calculations. HTTP polling to determine which containers had room. Overflow counters that predicted how many containers would be needed. Each approach added coordination complexity and new failure modes.
The approach that worked is the simplest one: when a call reaches the gateway because all containers are full, set desiredCount = active_containers + 1. That's it.
If the system already scaled (another gateway call arrived first), the operation is a no-op -- ECS is already launching the new container. If the new container fills up and another call overflows, the same rule fires again: active_containers + 1. The system converges to the right size without predicting demand.
The trade-off is that we scale one container at a time. If twelve calls overflow simultaneously, we add one container, absorb six calls, and the remaining six stay on the gateway until the next overflow triggers another scale-up. In practice, this means some callers spend an extra 60 seconds on the gateway. Those callers are having a real conversation the entire time. We decided this was an acceptable trade for eliminating the coordination bugs that came with trying to predict exactly how many containers we'd need.
What happens when traffic drops
Scaling up is easy. Scaling down without dropping active calls is the part that requires care.
Each container runs an idle check every 60 seconds. If the container has no active calls and the customer's last call was more than ten minutes ago, it initiates a scale-down. But it doesn't set the service to zero. It scales N-1: removes one container, resets the idle timer, and lets the remaining containers decide for themselves.
A Redis lock prevents multiple containers from scaling down at the same time. The first idle container acquires the lock, scales N-1, and exits. The lock expires in 30 seconds. The remaining containers get a fresh ten-minute idle window before the next one scales down.
The sequence for a customer who had a burst of 20 calls across 4 containers:
t+0min   4 containers, calls ending
t+10min  Container A idle, acquires lock, scales 4->3, exits
t+20min  Container B idle, acquires lock, scales 3->2, exits
t+30min  Container C idle, acquires lock, scales 2->1, exits
t+40min  Container D idle, scales 1->0, enters sleep mode
If a call arrives at any point in this sequence, the idle timer resets and the scale-down pauses. The gateway also resets the idle timer while it's holding calls waiting to transfer -- so containers don't shut down while the gateway is trying to hand off to them.
The zombie problem
We learned something about distributed systems that the textbooks mention but don't emphasize enough: containers don't die cleanly.
When ECS kills a container, it sends SIGTERM, waits 30 seconds, then SIGKILL. If the process doesn't close its Redis connections during that window, the TCP sockets stay open. Redis Cloud doesn't detect the dead sockets. From Redis's perspective, those connections are still active clients, consuming slots against the max client limit.
We found this during testing. After scaling up to 5 containers and back down to zero, 160 zombie Redis connections persisted from containers that had been dead for hours. The dev Redis instance had a 256 client limit. When we scaled up again, new containers couldn't connect -- they hit the limit and fell back to default configuration, greeting callers with "Thank you for calling Default Business" instead of the customer's configured persona.
The fix has two parts. First, we explicitly close Redis connections in every code path that handles call teardown -- the guidance polling loop, the idle shutdown loop, the capacity tracker. Second, each container's capacity key in Redis has a 30-second TTL refreshed by a heartbeat thread. When the container dies, the heartbeat stops, and the key expires. The aggregate capacity calculation only counts containers with live heartbeats.
This doesn't solve the zombie TCP connections (that requires a Redis-side idle timeout), but it prevents zombie containers from inflating the capacity count and misleading the scaling logic.
The 20-call test, in detail
The opening claim deserves its receipts. We ran 20 simultaneous calls from a cold start (zero containers) with 10-second intervals between each call:
| Time | Event | Containers | Active calls |
|---|---|---|---|
| t+0s | Call 1, gateway holds, scales 0->1 | 0 | 0 |
| t+60s | Container 1 healthy, gateway redirects calls 1-6 | 1 | 6 |
| t+70s | Call 7 overflows, gateway holds, scales 1->2 | 1 | 6 |
| t+120s | Container 2 healthy, absorbs calls 7-12 | 2 | 12 |
| t+130s | Call 13 overflows, scales 2->3 | 2 | 12 |
| t+180s | Container 3 healthy, absorbs calls 13-18 | 3 | 18 |
| t+190s | Calls 19-20, scales 3->4 | 3 | 18 |
| t+250s | Container 4 healthy, absorbs calls 19-20 | 4 | 20 |
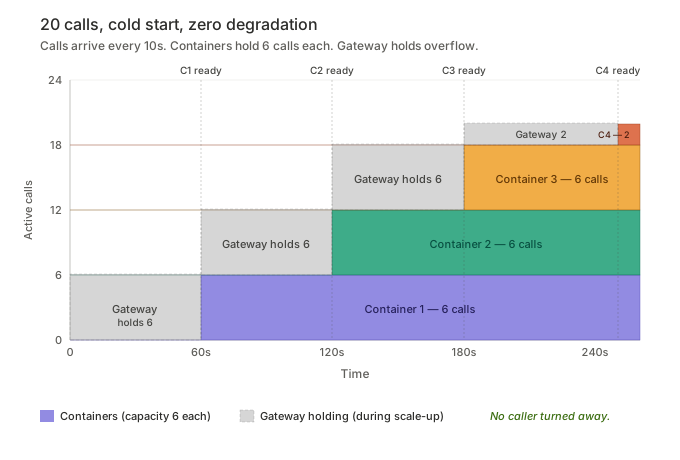
Response latency across all 20 calls: avg 603ms, p50 568ms, p90 894ms. The baseline for a single call on an idle container is 953ms avg. Twenty concurrent calls performed better than the baseline, because the load was distributed across fresh containers rather than concentrated on one -- and the p90 of 894ms still sits below the ~1000ms threshold where callers typically perceive a system as broken.3
The six callers who arrived during a cold start or overflow had a real conversation on the gateway for 60-90 seconds before being seamlessly transferred. For comparison: typical contact-center abandonment rates run 5-8%, and most abandonment happens at the 30 and 60-second waiting marks.6 A CPU-based scaling system that takes three minutes to react would, in expectation, lose a meaningful fraction of those callers before the new container ever came online.
The economics
For a platform, the cost model matters as much as the architecture.
A traditional CPU-based auto-scaling policy requires a minimum baseline to be responsive. You need at least one container running at all times, or you accept the cold-start penalty while CloudWatch detects the spike, evaluates the policy, and launches a task. Running a single 1 vCPU / 2GB ARM Fargate task 24/7 at on-demand pricing comes out to roughly $29/month -- a floor cost the customer pays whether they receive one call or a thousand.
Capacity-aware scaling with a gateway absorber has a different cost structure. The customer pays for compute only when calls are active, plus a small margin for the ten-minute idle timeout. A customer receiving 10 calls per day, averaging 3 minutes each, uses roughly 40 minutes of compute per day. That's $0.80/month in Fargate time instead of $29.
Gateway calls are billed at $0.25 per call to cover the platform cost of holding the call for 60-90 seconds while the customer's container spins up. This is transparent to the customer and predictable -- they know exactly what a cold-start call costs. For a customer in on-demand mode receiving 10 calls per day, 2-3 of those might hit the gateway (first call of the day, plus any that arrive during a scaling event). That's $0.50-0.75/day in gateway fees on top of the compute cost.
The gateway pool itself has its own dynamic scaling policy to ensure there are always spare containers available based on demand. When the gateway is genuinely at capacity -- all gateway containers are serving calls simultaneously -- that's when the caller hears "All of our assistants are currently busy, please try your call again later." This is the hard ceiling, and it's sized to be rare.
For customers who need guaranteed capacity, the default production configuration starts with 2 always-on containers. This handles up to 12 simultaneous calls with minimal performance impact and scales up automatically when demand exceeds that baseline. The gateway only gets involved when all running containers are full and ECS is launching a new one -- a window that typically lasts 60-90 seconds per scaling event.
What we're not claiming
This architecture has constraints and they should be stated clearly.
The 60-90 second cold start is real. We've hidden it from the caller experience, but the underlying Fargate launch time hasn't changed. Independent benchmarks consistently report Fargate cold starts in the 20-60 second range for typical production workloads, with launch time dominated by ENI provisioning and image pull.7 If you need sub-second container readiness, you need warm pools or provisioned capacity. We've made the cold start invisible, not eliminated it.
Six calls per container is our number, not yours. It depends on your voice pipeline: which STT, which LLM, which TTS, what parameter count, what vCPU allocation. The approach (measure quality at each concurrency level, find the cliff, set the limit below it) is transferable. The specific number is not.
Burst scaling adds one container at a time. If 30 calls arrive in 10 seconds, the system scales up one container per overflow cycle. Some callers spend 2-3 minutes on the gateway instead of 1. For our use case -- business phone calls where the gateway provides a full conversation -- this is acceptable. For a use case where gateway time is dead air, it wouldn't be.
Zombie connections are a real operational concern. Any system that scales containers up and down will accumulate orphaned connections to shared resources. Redis, database connection pools, message queue consumers -- anything with a persistent connection can leak when containers die ungracefully. We've mitigated it but not eliminated it. A Redis-side idle timeout is the complete fix, pending an audit of long-running tasks that legitimately hold connections.
The shape of it
The default architectures for voice AI -- CPU-based scaling, warm pools, over-provisioning -- all encode an assumption that scaling and quality are in tension. That you either over-provision for responsiveness or accept degradation during traffic spikes.
The assumption is wrong, but the evidence for it is everywhere. CPU-based auto-scaling really does react too slowly. Cold starts really do destroy caller experience. Multi-tenant containers really do risk cross-contamination.
The mistake is treating these as fundamental constraints rather than implementation choices. CPU is the wrong scaling signal -- use call count. Cold starts are a container problem -- solve it at the call-answering layer. Multi-tenancy is a data isolation problem -- solve it at the database layer.
Once you separate the problems, each one has a straightforward solution. The compound effect is a system that scales from zero to any number of concurrent calls with no degradation in caller experience, no minimum infrastructure cost, and no compromise on tenant isolation.
We built it. It works. The twenty-call test proves it.
Remote Assistant is an AI operations platform that deploys autonomous AI employees for businesses. Learn more about building on our developer platform.
Sources
Footnotes
-
AWS Auto Scaling documentation: "Scaling on metrics with a five-minute frequency can result in a slower response time and scaling on stale metric data. By default, EC2 instances are enabled for basic monitoring, which means metric data for instances is available at five-minute intervals." See Best practices for scaling plans. ↩
-
Stivers, T., Enfield, N. J., Brown, P., Englert, C., Hayashi, M., Heinemann, T., Hoymann, G., Rossano, F., de Ruiter, J. P., Yoon, K.-E., & Levinson, S. C. (2009). Universals and cultural variation in turn-taking in conversation. Proceedings of the National Academy of Sciences, 106(26), 10587-10592. The cross-linguistic study found average inter-turn gaps of approximately 200ms across ten languages. ↩
-
Production voice AI research consistently identifies ~800ms as the threshold above which callers begin to perceive awkward pauses, and ~1000ms+ as the threshold where users assume the system is broken. See discussion of latency thresholds in voice AI: The 300ms rule, Voice AI latency benchmarks. For an academic treatment of response delay tolerance in conversational agents, see Kim et al. (2025), "Mitigating Response Delays in Free-Form Conversations with LLM-powered Intelligent Virtual Agents," arXiv:2507.22352. ↩ ↩2 ↩3
-
Load testing conducted on 1 vCPU / 2GB ARM Fargate tasks running Deepgram STT, Groq Llama-3.3-70b LLM, and Cartesia TTS. Response latency measured from user speech end to first TTS audio byte at the transport layer. ↩
-
Capacity tracking uses Redis HASH keys with a 30-second heartbeat TTL. Key pattern:
capacity:v2:{customer_id}:{task_id}. Production Redis (not per-customer Redis) is used so the gateway can read capacity for all customers without switching context. ↩ -
Industry benchmarks for contact-center abandonment rates fall in the 5-8% range, with abandonment heavily concentrated at the 30-second and 60-second hold-time marks. See Sprinklr call center statistics and Calabrio's abandon rate guide. ↩
-
AWS Fargate cold starts are dominated by ENI provisioning (10-30s) and container image pull (5-60s depending on image size and compression). Independent production benchmarks report 20-60 second cold starts for typical workloads. See AWS's own analysis in Reducing AWS Fargate Startup Times with zstd Compressed Container Images and community-reported benchmarks. ↩